
How do I create reports?
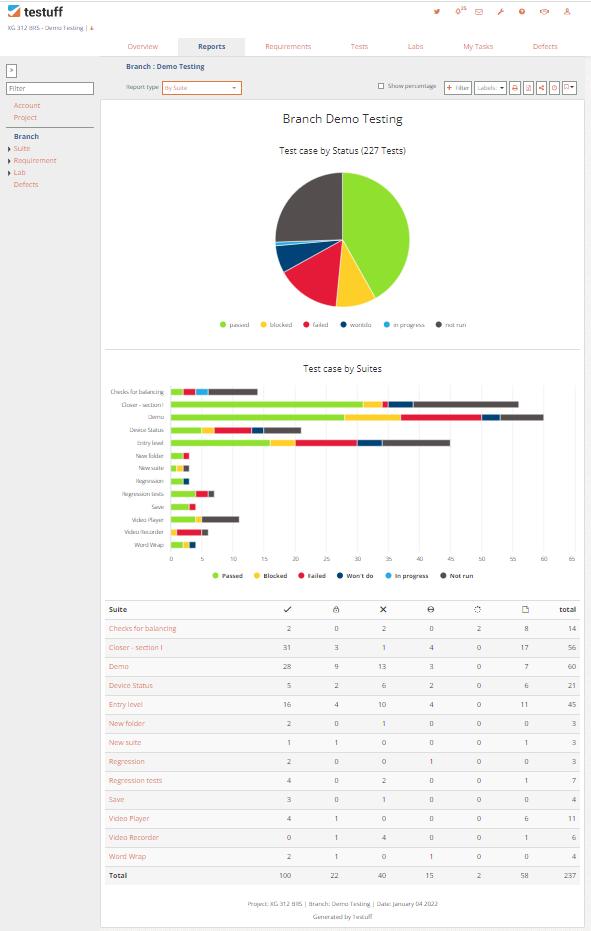
In the Reports screen, a variety of report types are available, including status reports, time tracking reports, and more. To create a report,
select the reports level (Branch, Suite, Requirement, Lab or defect), and then the Report type as required. The report will display below.
Can I customize reports?
Use the different filters at the top, to adjust the displayed data. You can also switch from numbers to percentages.
How up-to-date are the reports?
Reports are generated on the fly, ensuring they are up-to-date at the time of creation.
 Note: Clicking on any chart in the report will direct you to the relevant screen where the data originates.
Why are the numbers on the pie and bar charts different?
- Pie Chart: Displays the status of tests based on their most recent update across all labs. If a test appears in multiple labs, only the last run will be shown.
- Bar Chart: Displays data for each lab separately, so the same test may appear multiple times.
Any other options to work with reports?
- Print Reports: Use the print icon at the top right.
- share Reports: Click the share icon to generate a URL that can be shared via email or social media, even with those who don’t have Testuff access.
- Download Data: Export the report data to Excel.
- Schedule Reports: Set up periodic email delivery of specific reports.
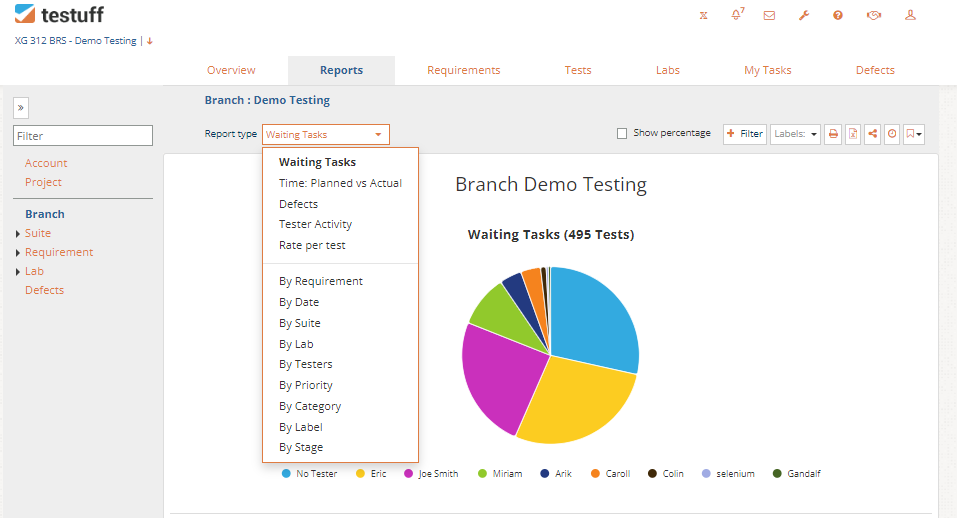
Are there any other reports available?
Additional reports are available at the top. Click on Report Type drop down list, to see the available report types, for the selected level.
Can I generate my own special reports?
Sure. Use the API, to pull any data and generate custom reports in any preferred format.
Can I ask for new reports?
Absolutely. We continually add new reports, often based on customer requests. If you have a suggestion for a new report, let us know.